Track System Activity with Monitor
The Monitor application in Officeclip will allow you to monitor all the machines in your organization from a single location.
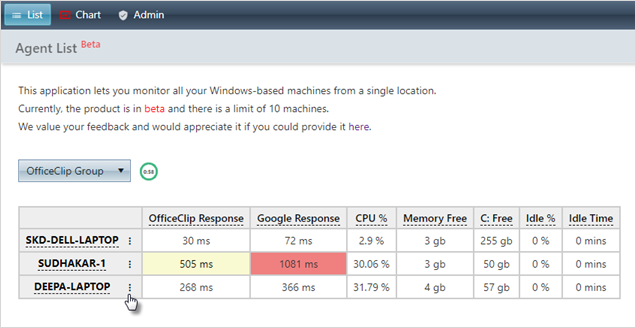
This application will monitor the OfficeClip response, Google Response, CPU%, Free memory, Idle% and Idle time.
Installing Monitor
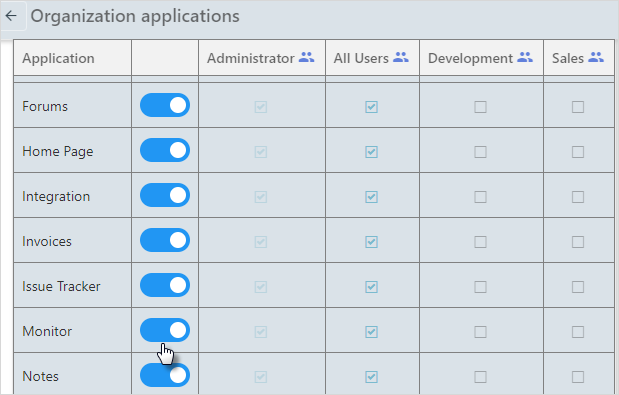
By default the application Monitor is switched Off in OfficeClip. To start using it:
- Go to Settings > Organization Settings > Privileges > Organization Applications
- Search for Monitor in the application list
and switch it On by clicking on the button.
- You will see the Monitor application under Desktop or under Service. Even after switching on the application if you are unable to see the application, then you can log out and then log in, and you will be able to see it.
To install the application on your machine and make it work:
- Go to Desktop / Issue Tracker > Monitor list screen.
- You will see all the instructions to install the Agent Monitor.
Click on the the Download button.
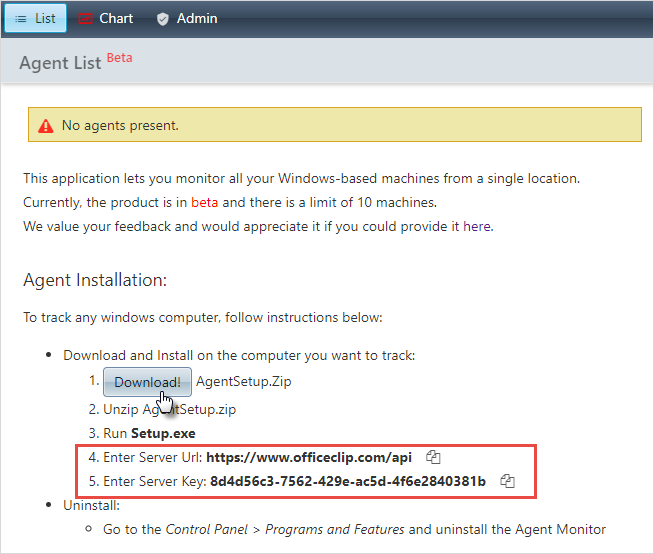
- After downloading, unzip the file and run the setup.exe file.
- While installing it will ask for the Server URL and
Server key. Copy this information from the instructions given
by clicking on the
 icon.
icon. - After these steps you will see agent monitor installed in your machine. Similarly, you need to ask all your users to install the Monitor application in your machine.
- When all the users install the application, the Administrator or
the manager will be able to monitor the activities of all the machines
whoever has installed the application.
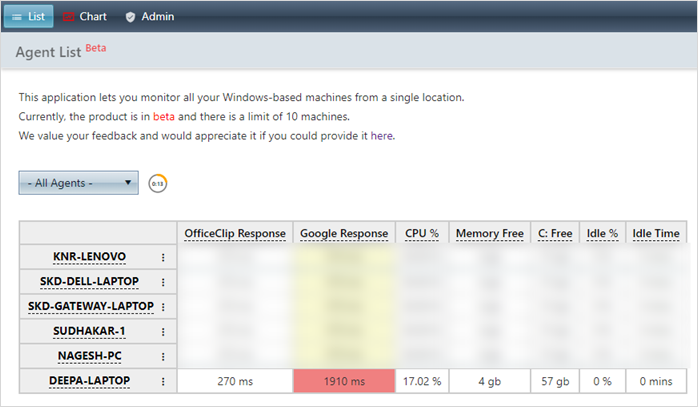
- Kindly note right now the application has the capacity to monitor only 10 machines and the data gets refreshed in every one minute.
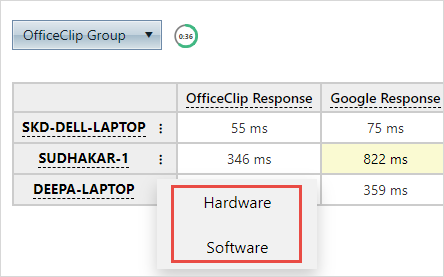
View Hardware-Software details
The Monitor application also allows you to view all the hardware and software details of the user's machine.
To view these details:
- Go to Monitor list screen.
- Click on the three dots where it displays the laptop names.
- Select the desired option.
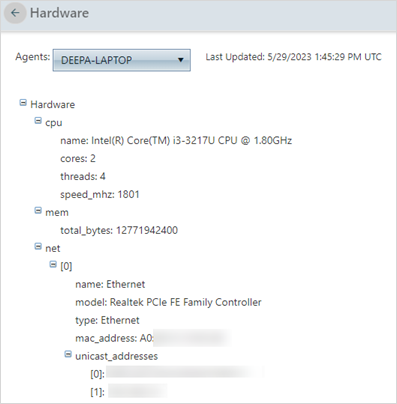
- If you select the hardware option, it will show all the hardware
details of user's machine.
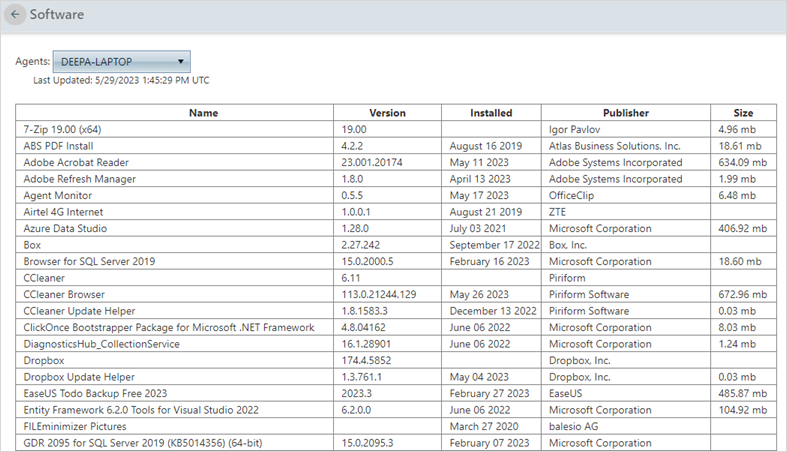
- If you select the software option, it will show all the software
details of user's machine.
Charts
On the list screen you can see all the data in the numerical form, but in the Charts section you can see all the data in graphical form.
To view the data in chart format:
- Click Monitor >
Chart
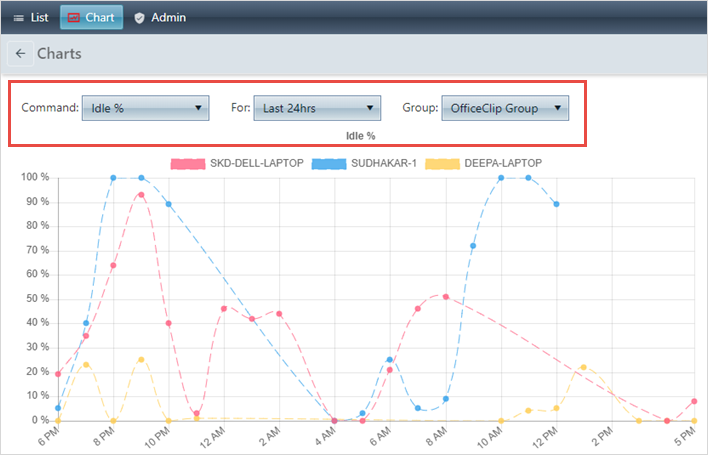
- From the dropdown in Command you can select the desired option you want to view like Idle time, free memory, CPU%, etc. Select from duration dropdown the time last hour, last 24 hours or last month and also select the desired group from the Group data.
- After selecting all the desired options you can view all the data you need.
- To learn how to set up commands, click here.