Monitor Admin Setup
After installing the application you need to set up few things in the Admin section to view all the required data.
Alias
- Click Desktop > Monitor > Admin
- Alias: In this screen you will see all the
machines, their registered date, alias/name, and whether they are
active or not.
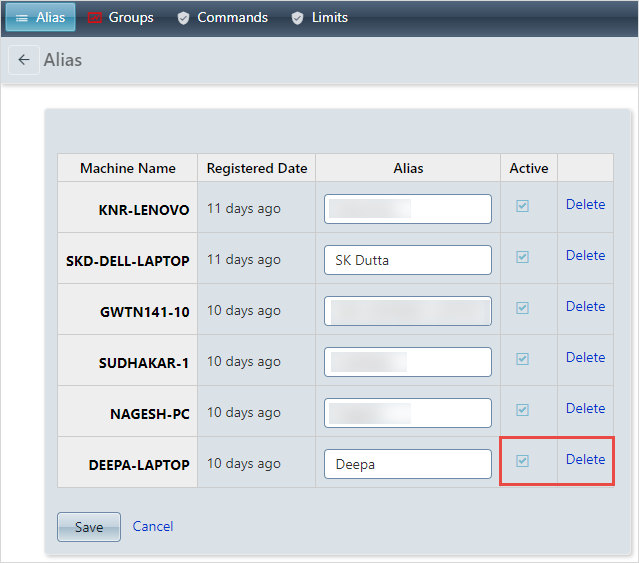
- You can add the desired name to all the machines as per your needs.
- You can activate or deactivate the machine by clicking on the checkbox in the Active column.
- To delete any machine from the list, simply click on the Delete button.
Groups
Groups: This section allows you to add multiple machines or agents in one group. You can create groups and add agents in different groups.
- Go to Admin > Groups
- Add a group name and click on the Add
button.

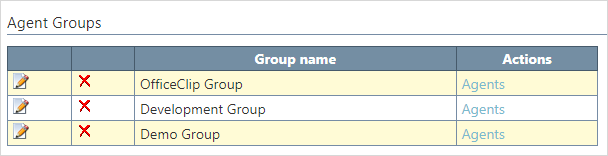
- You will see the group created. In this way you can create groups
for different agents.
- Click on the Agents to add the agents or
machines in the group.
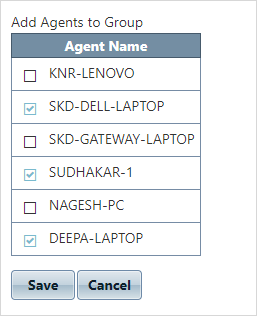
- Check mark the agents which you want to add in the group and click Save.
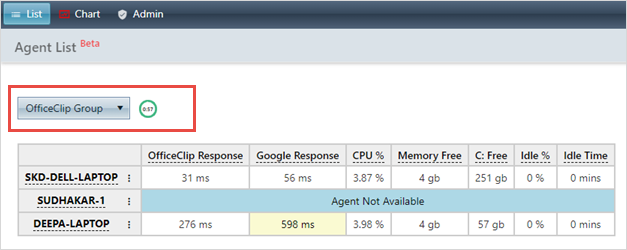
- Now you can go to the list screen and select the group from the
dropdown and view the data for that particular group.
- You can edit or delete the group name from the
Admin > Groups
screen. In the Agent groups section, click on the
 icon to edit
and change the group name and click
icon to edit
and change the group name and click  icon to save changes. To delete a group, click on the
  icon.
icon.
Commands
Before we learn how to use commands, let us understand few concepts related to them.
- Arg 1: means an argument where we enter a url or a keyword to check the response or value
- Arg 2: means an argument where we enter a url or a keyword to check the response or value
- Units: shows ping unit in ms, the idle % in percent, idle time in minutes and memory in gb
- Url.ping: means when you add a url in the system, the url.ping detects how much time it takes to get data from that particular link
- Url.check: will check that if we make a call to that particular url, and the value gets compared to the second argument, then it checks whether the value is correct or not. It basically checks the url
- Cpu.percent: shows the percent of data the CPU is utilizing
- Memory.free: shows the free memory(RAM) in the users system
- Network.specific: shows the load a particular network is carrying. Check the network in the hardware list in the list screen
- Drive.free: shows the free disk space in the hard drive
- Os.uptime: shows the time elapsed for your operating system since it was started
- Os.idletime: shows the idle time of a machine in minutes
- Os.idlepercent: shows the idle time of a machine in percentage
Let us see how to use the Commands within the Monitor application:
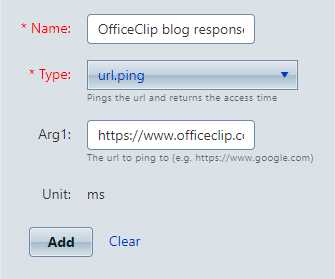
- Url.ping: Enter a name for the ping, select
the type as url.ping, in Arg1 enter the url for which
you need to check the ping, and click Add.
- Url.check:
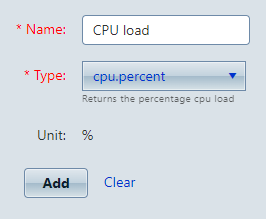
- Cpu.percent: Enter the name, select the
type as cpu.percent, and click Add.
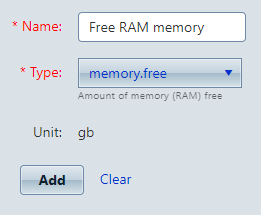
- Memory.free: Enter the name, select the
type as memory.free, and click Add.
- Network.specific:
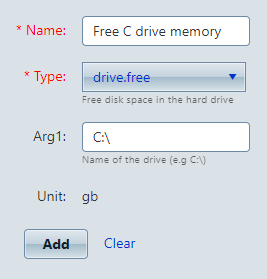
- Drive.free: Enter the name, select the type
as drive.free, in Arg1 enter the drive for which you
want to view free memory, and click Add.
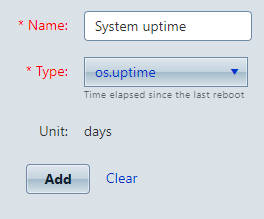
- Os.uptime: Enter the name, select the type
as os.uptime, and click Add.
- Os.idletime: Enter the name, select the
type as os.idletime, and click Add. It
will show the idletime in minutes.
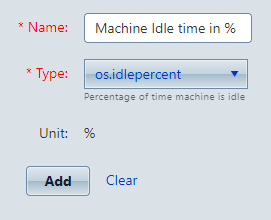
- Os.idlepercent: Enter the name, select the
type as os.idlepercent, and click Add.
It will show the machine idletime in percentage.
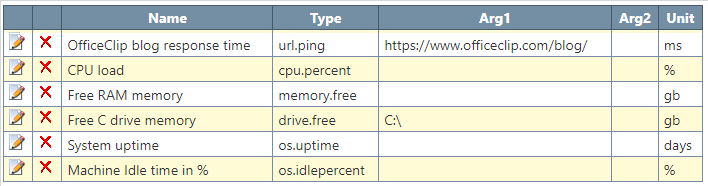
- Once saved, you will see list of all the commands and their
details.
- To edit the command name, click on the icon to edit,
change the name and click
icon to save changes. To delete a command, click on the icon.
Limits
- In this section, you can set the warning and error limits for the commands.
- The system has predefined limits, but you can customize them
according to your organization’s needs.
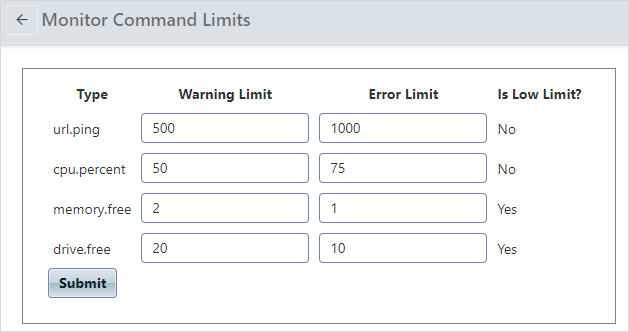
- Set the limits and click on Submit button.
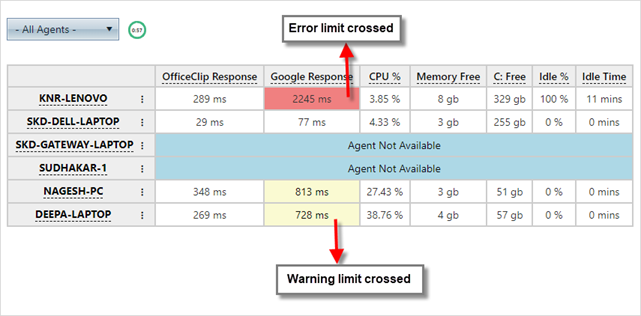
- On the list screen, if any machine has crossed the warning limit
it will show up in yellow color, while if it has crossed the error
limit, it will be in red color.